[ 머신러닝 ] 로지스틱 회귀
2023. 9. 6. 03:48ㆍ머신러닝
728x90
import numpy as np
import pandas as pd
import seaborn as sns
import matplotlib.pyplot as plt
hr_df=pd.read_csv('/content/drive/MyDrive/8. 머신러닝 딥러닝/hr.csv')hr_df.head()✔️ 결과

hr_df.info()<class 'pandas.core.frame.DataFrame'>
RangeIndex: 54808 entries, 0 to 54807
Data columns (total 13 columns):
# Column Non-Null Count Dtype
--- ------ -------------- -----
0 employee_id 54808 non-null int64
1 department 54808 non-null object
2 region 54808 non-null object
3 education 52399 non-null object
4 gender 54808 non-null object
5 recruitment_channel 54808 non-null object
6 no_of_trainings 54808 non-null int64
7 age 54808 non-null int64
8 previous_year_rating 50684 non-null float64
9 length_of_service 54808 non-null int64
10 awards_won? 54808 non-null int64
11 avg_training_score 54808 non-null int64
12 is_promoted 54808 non-null int64
dtypes: float64(1), int64(7), object(5)
memory usage: 5.4+ MB
- employee_id: 임의의 직원 아이디
- department: 부서
- region: 지역
- education: 학력
- gender: 성별
- recruitment_channel: 채용 방법
- no_of_trainings: 트레이닝 받은 횟수
- age: 나이
- previous_year_rating: 이전 년도 고과 점수
- length_of_service: 근속 년수
- awards_won: 수상 경력
- avg_training_score: 평균 고과 점수
- is_promoted: 승진 여부
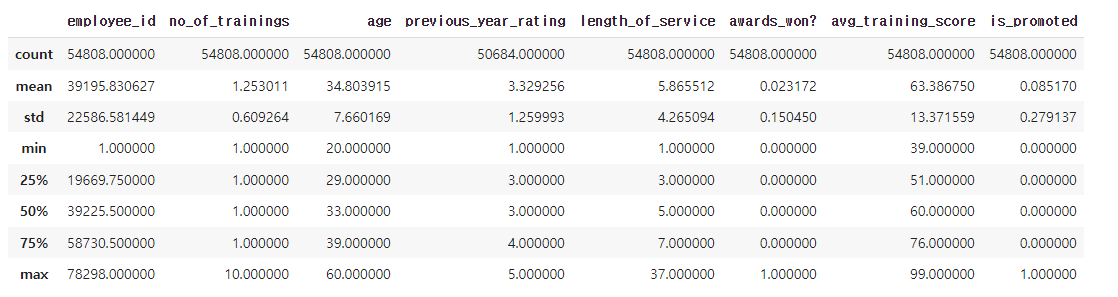
hr_df.describe()
✔️ 결과
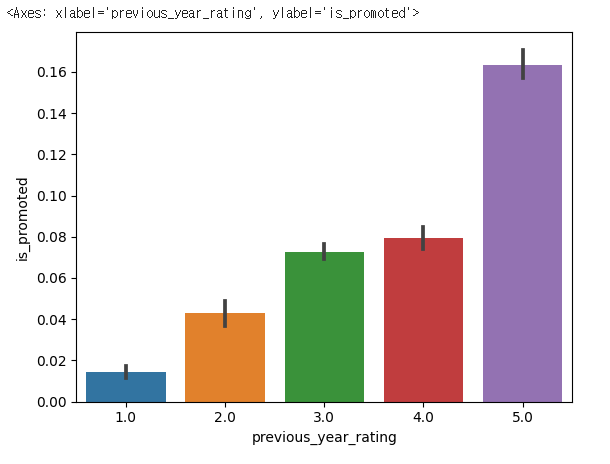
sns.barplot(x= 'previous_year_rating',y='is_promoted',data=hr_df)
✔️ 결과
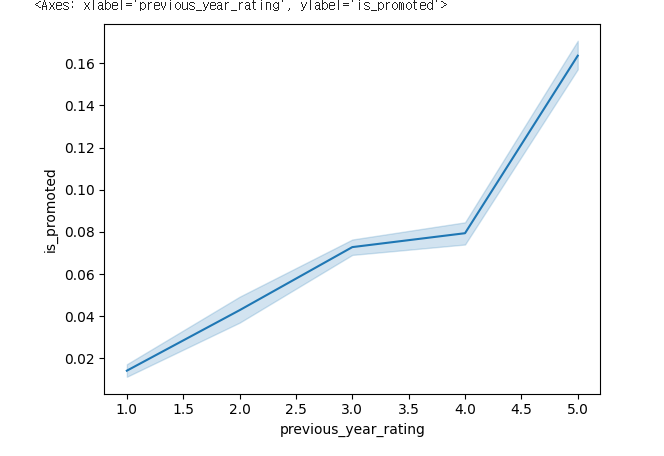
sns.lineplot(x= 'previous_year_rating',y='is_promoted',data=hr_df)
✔️ 결과
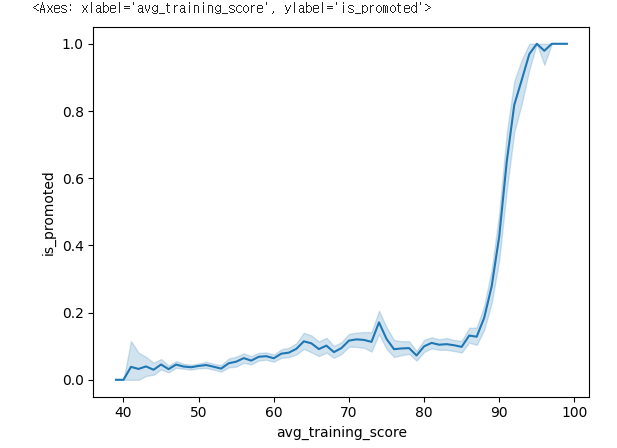
sns.lineplot(x= 'avg_training_score',y='is_promoted',data=hr_df)
✔️ 결과
sns.barplot(x= 'recruitment_channel',y='is_promoted',data=hr_df)
✔️ 결과
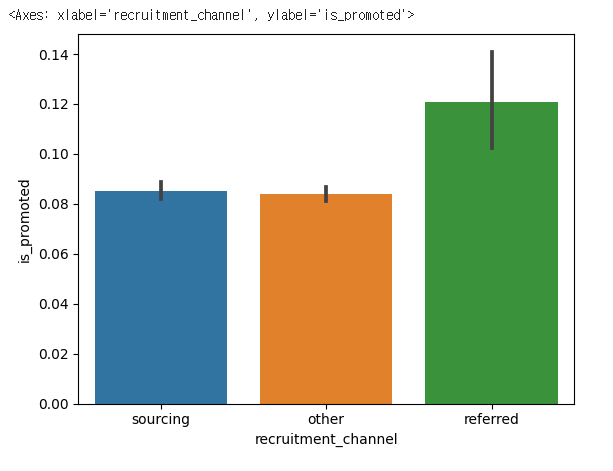
hr_df['recruitment_channel'].value_counts()
✔️ 결과
other       30446
sourcing    23220
referred     1142
Name: recruitment_channel, dtype: int64
sns.barplot(x= 'gender',y='is_promoted',data=hr_df)✔️ 결과
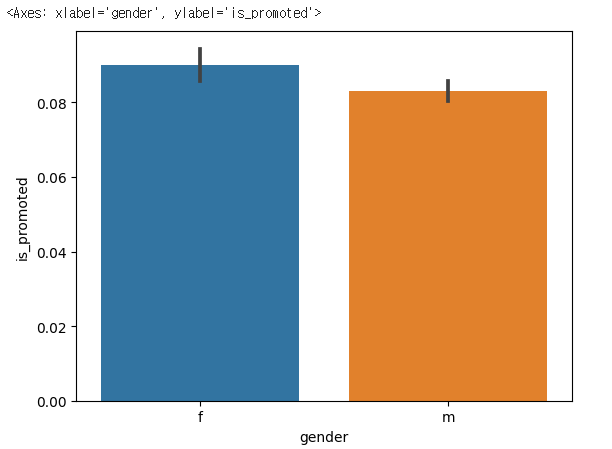
hr_df['gender'].value_counts()
✔️ 결과
m    38496
f    16312
Name: gender, dtype: int64
sns.barplot(x= 'department',y='is_promoted',data=hr_df)
plt.xticks(rotation=45) # 글씨가 길어 겹칠때 이용
✔️ 결과
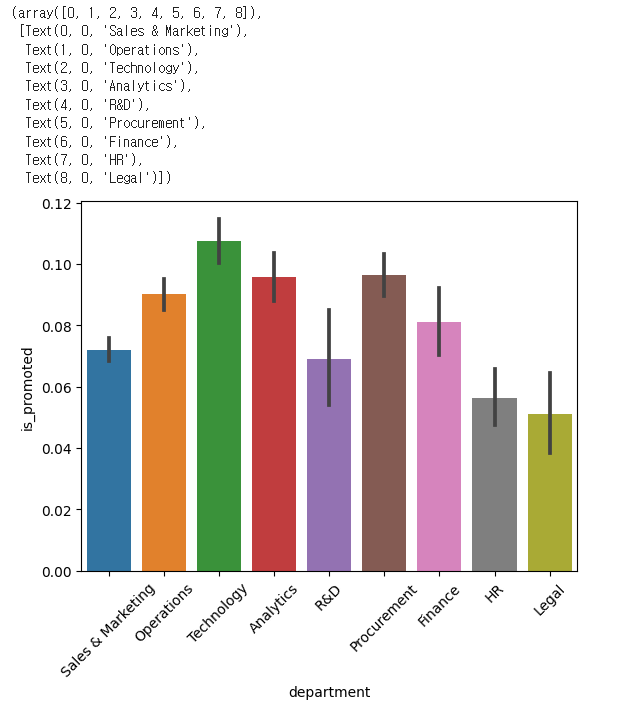
hr_df['department'].value_counts()
Sales & Marketing 16840
Operations 11348
Technology 7138
Procurement 7138
Analytics 5352
Finance 2536
HR 2418
Legal 1039
R&D 999
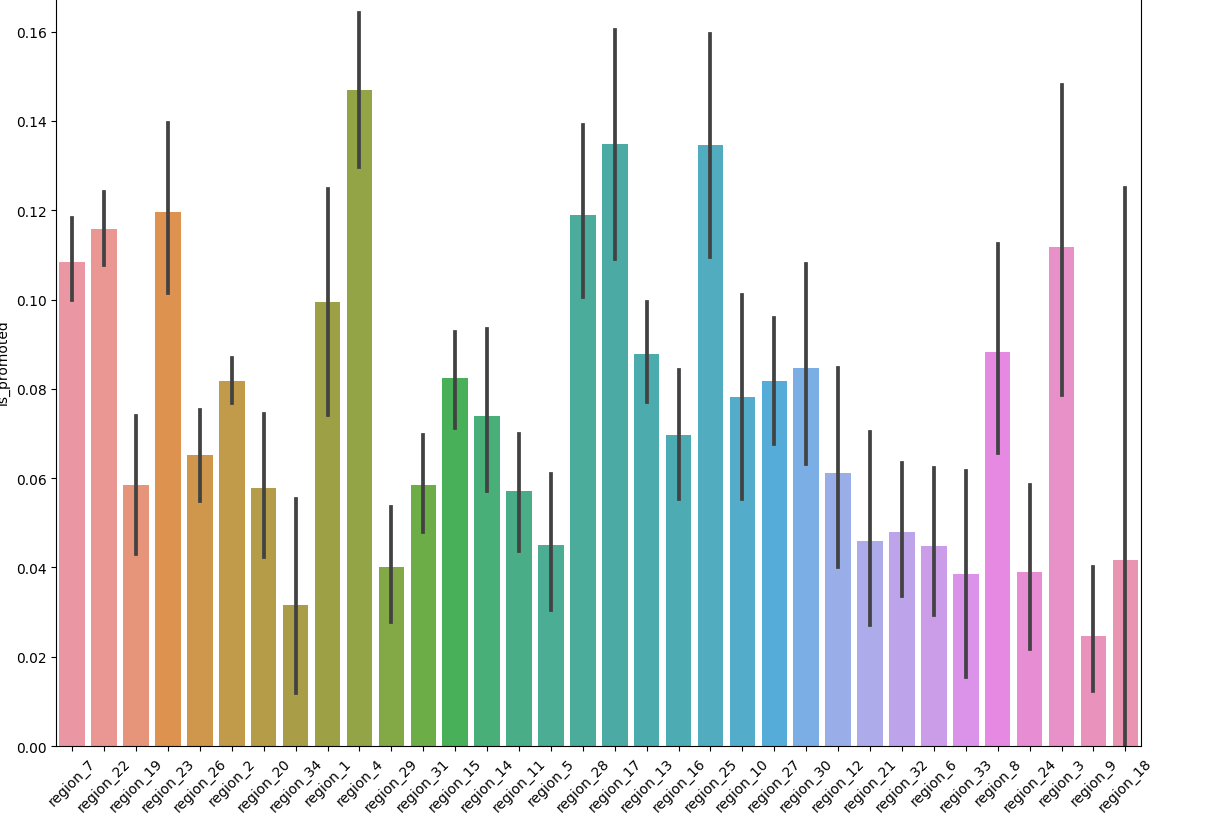
Name: department, dtype: int64plt.figure(figsize=(14,10))
sns.barplot(x='region',y='is_promoted',data=hr_df)
plt.xticks(rotation=45)
✔️ 결과
hr_df.isna().mean()
employee_id             0.000000
department              0.000000
region                  0.000000
education               0.043953
gender                  0.000000
recruitment_channel     0.000000
no_of_trainings         0.000000
age                     0.000000
previous_year_rating    0.075244
length_of_service       0.000000
awards_won?             0.000000
avg_training_score      0.000000
is_promoted             0.000000
dtype: float64
hr_df['education'].value_counts()
Bachelor's          36669
Master's & above    14925
Below Secondary       805
Name: education, dtype: int64
hr_df['previous_year_rating'].value_counts()
3.0    18618
5.0    11741
4.0     9877
1.0     6223
2.0     4225
Name: previous_year_rating, dtype: int64
hr_df = hr_df.dropna()
hr_df.info()
<class 'pandas.core.frame.DataFrame'>
Int64Index: 48660 entries, 0 to 54807
Data columns (total 13 columns):
 #   Column                Non-Null Count  Dtype
---  ------                --------------  -----
 0   employee_id           48660 non-null  int64
 1   department            48660 non-null  object
 2   region                48660 non-null  object
 3   education             48660 non-null  object
 4   gender                48660 non-null  object
 5   recruitment_channel   48660 non-null  object
 6   no_of_trainings       48660 non-null  int64
 7   age                   48660 non-null  int64
 8   previous_year_rating  48660 non-null  float64
 9   length_of_service     48660 non-null  int64
 10  awards_won?           48660 non-null  int64
 11  avg_training_score    48660 non-null  int64
 12  is_promoted           48660 non-null  int64
dtypes: float64(1), int64(7), object(5)
memory usage: 5.2+ MB
for i in ['department','region','education','gender','recruitment_channel']:
  print(i,hr_df[i].nunique())
department 9
region 34
education 3
gender 2
recruitment_channel 3
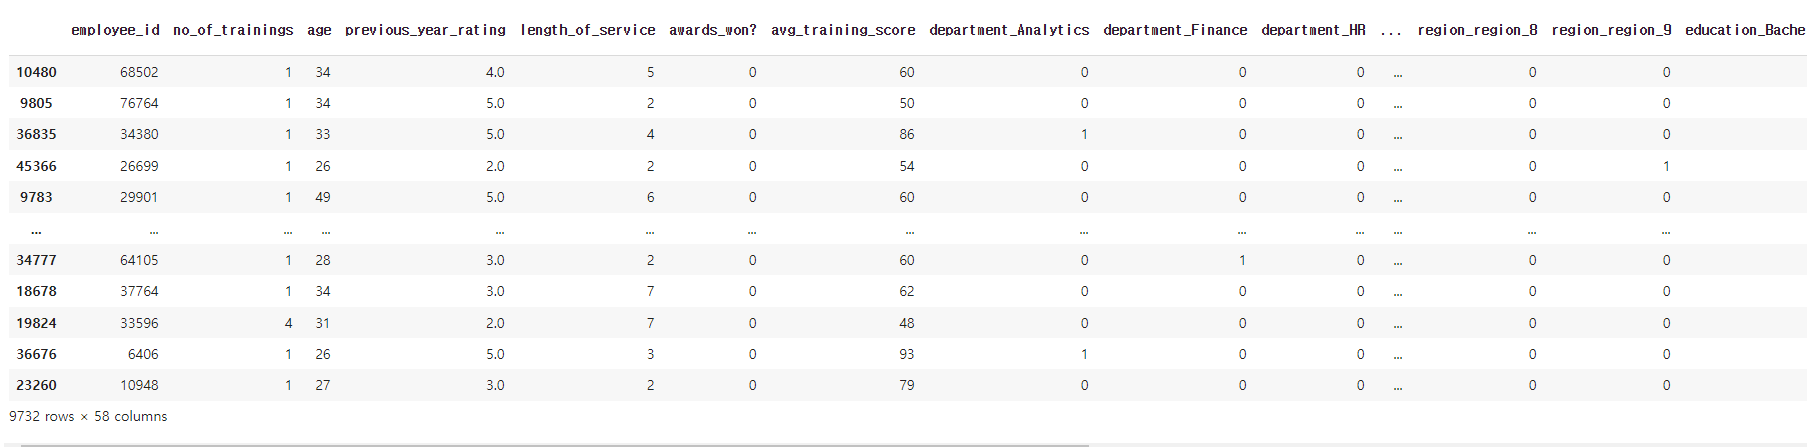
hr_df = pd.get_dummies(hr_df,columns=['department','region','education','gender','recruitment_channel'])
hr_df.head(3)
✔️ 결과

pd.get_option('display.max_columns',60)
20
hr_df.head(3)
✔️ 결과

from sklearn.model_selection import train_test_split
x_train,x_test,y_train,y_test = train_test_split(hr_df.drop('is_promoted',axis=1),hr_df['is_promoted'],test_size=0.2,random_state=10)
2. 로지스틱 회귀(Logistic Regression)
- 둘 중의 하나를 결정하는 문제(이진 분류)를 풀기 위한 대표적인 알고리즘
- 도큐먼트
- 3개 이상의 클래스에 대한 판별을 하는 경우 OvR( One -vs - Rest), OvO( One-vs- One) 전략으로 판별
대부분 OvR 전략을 선호, 데이터가 한쪽으로 많이 치우친 경우 OvO을 사용
from sklearn. linear_model import LogisticRegression
lr=LogisticRegression()
lr.fit(x_train ,y_train)
-------------------------------------------------------------------------------------
# 결과
/usr/local/lib/python3.10/dist-packages/sklearn/linear_model/_logistic.py:458: ConvergenceWarning: lbfgs failed to converge (status=1):
STOP: TOTAL NO. of ITERATIONS REACHED LIMIT.

Increase the number of iterations (max_iter) or scale the data as shown in:
    https://scikit-learn.org/stable/modules/preprocessing.html
Please also refer to the documentation for alternative solver options:
    https://scikit-learn.org/stable/modules/linear_model.html#logistic-regression
  n_iter_i = _check_optimize_result(

LogisticRegression
LogisticRegression()
pred = lr.predict(x_test)
from sklearn. metrics import accuracy_score,confusion_matrix
from sklearn.metrics import accuracy_score
accuracy_score(y_test,pred)
0.9114262227702425hr_df['is_promoted'].value_counts()
0 44428
1 4232
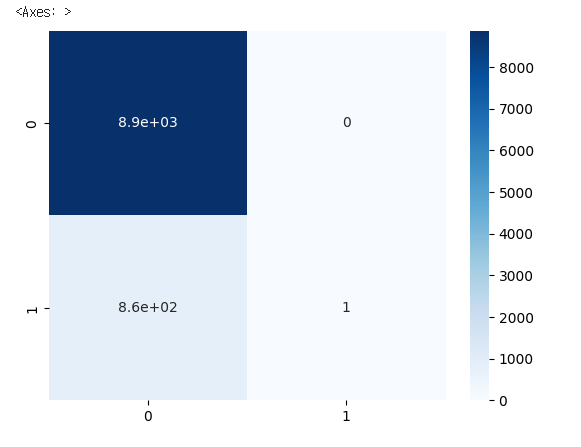
Name: is_promoted, dtype: int643. 혼돈 행렬(confusion matrix)
- 정밀도와 재현율( 민감도 )을 활용하여 평가용 지수
TN(8869)   FP(0)
FN(862) TP(1)- TN: 승진하지 못했는데, 승진하지 못했다고 예측
- FN: 승진하지 못했는데, 승진했다고 예측
- FP: 승진했는데, 승진하지 못했다고 예측
- TP: 승진했는데, 승진하지 못했다고 예측
confusion_matrix(y_test,pred)
array([[8869,    0],
       [ 862,    1]])
sns.heatmap(confusion_matrix(y_test, pred), annot=True, cmap='Blues')
✔️ 결과
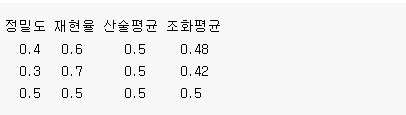
3-1. 정밀도(precision)
- TP / (TP + FP)
- 무조건 양성으로 판단해서 계산하는 방법
- 1이라고 예측한 것 중, 얼마 만큼을 제대로 맞혔는가?
3-2. 재현율(recall)
- TP/(TP+FN)
- 정확하게 감지한 양성 샘플의 비율
- 실제 1이라고 예측한것 중에 얼마 만큼을 제대로 맞췄는가?
- 민감도 또는 TPR(True Positive Rate)라고도 부름
3-3 f1 score
- 정밀도와 재현율의 조화평균을 나타내는 지표
-
2∗정밀도∗재현율정밀도+재현율=TPTP+FN+FP2
from sklearn.metrics import precision_score, recall_score, f1_score
precision_score(y_test, pred)
1.0recall_score(y_test,pred)
0.0011587485515643105f1_score(y_test,pred)
0.0023148148148148147lr.coef_# 58개 컬럼에 대한 기울기
array([[-5.42682567e-06, -2.11566320e-01, -1.24739314e-01,
         4.04217840e-01,  8.39462548e-02,  1.19382822e-01,
         1.24469097e-02, -4.53116409e-02, -1.59556720e-02,
        -1.69079211e-02, -1.06814883e-02,  3.10169499e-02,
         3.47912379e-03, -1.69516987e-02, -1.37996914e-02,
        -1.51941604e-02, -2.88706914e-03, -2.41993427e-03,
        -1.84270273e-02, -6.87835341e-03, -2.43612077e-03,
        -5.00401302e-03, -7.32654108e-03, -7.67662052e-03,
         7.71412885e-03, -3.21353065e-04, -6.68708228e-03,
         2.55409975e-02, -1.02529819e-02, -7.25376472e-03,
         9.23097034e-03,  9.63606751e-03, -9.39043583e-03,
         5.16728257e-03, -2.15726175e-02, -1.16101632e-02,
         9.39154969e-03, -1.82813463e-02,  1.50261133e-03,
        -1.97860883e-03, -2.28665036e-02, -1.35441186e-02,
        -5.26900930e-03, -6.03421587e-03,  3.29129457e-02,
        -1.48312957e-02, -1.18516648e-02,  2.54568502e-02,
        -2.39518611e-03, -9.66357577e-03, -2.00440936e-01,
        -1.40474208e-02,  1.14182158e-01, -1.53689321e-02,
        -8.49372671e-02, -6.62000218e-02,  4.04855793e-03,
        -3.81547353e-02]])
x_test
✔️ 결과
# 독립변수 2개, 종속변수 1개
tempx=hr_df[['age','length_of_service']]
tempy = hr_df['is_promoted']
temp_lr =LogisticRegression()
temp_lr.fit(tempx,tempy)
temp_df = pd.DataFrame({'age':[20,27,30],'length_of_service':[1,3,6]})
temp_df
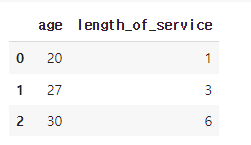
pred= temp_lr.predict(temp_df)
pred
✔️ 결과
array([0, 0, 0])temp_lr.coef_
✔️ 결과
array([[-0.01074458, -0.00053409]])temp_lr.intercept_
✔️ 결과
array([-1.96818509])proba =temp_lr.predict_proba(temp_df)
proba
✔️ 결과
array([[0.89876806, 0.10123194],
       [0.9055003 , 0.0944997 ],
       [0.90835617, 0.09164383]])
4. 교차 검증(Cross Validation)
- train_test_split에서 발생하는 데이터의 섞임에 따라 성능이 좌우되는 문제를 해결하기 위한 기술
- k겹(Fold) 교차 검증을 가장 많이 사용
from sklearn.model_selection import KFold
kf = KFold(n_splits=5)
kf
✔️ 결과
KFold(n_splits=5, random_state=None, shuffle=False)for train_index, test_index in kf.split(range(len(hr_df))):
print(train_index, test_index)
print(len(train_index), len(test_index))
✔️ 결과
[    2     3     4 ... 48656 48657 48659] [    0     1     5 ... 48652 48653 48658]
38928 9732
[    0     1     2 ... 48657 48658 48659] [   18    23    29 ... 48639 48641 48645]
38928 9732
[    0     1     2 ... 48657 48658 48659] [   12    15    17 ... 48647 48650 48654]
38928 9732
[    0     1     2 ... 48654 48656 48658] [    3    24    31 ... 48655 48657 48659]
38928 9732
[    0     1     3 ... 48657 48658 48659] [    2     4     6 ... 48640 48644 48656]
38928 9732
kf = KFold(n_splits=5,random_state=10,shuffle=True)
kf
✔️ 결과
KFold(n_splits=5, random_state=10, shuffle=True)for train_index, test_index in kf.split(range(len(hr_df))):
X = hr_df.drop('is_promoted', axis=1)
y = hr_df['is_promoted']
acc_list = []
for train_index, test_index in kf.split(range(len(hr_df))):
  X = hr_df.drop('is_promoted', axis=1)
  y = hr_df['is_promoted']
X_train = X.iloc[train_index]
X_test = X.iloc[test_index]
y_train = y.iloc[train_index]
y_test = y.iloc[test_index]
lr = LogisticRegression()
lr.fit(X_train, y_train)
pred = lr.predict(X_test)
acc_list.append(accuracy_score(y_test, pred))
✔️ 결과
/usr/local/lib/python3.10/dist-packages/sklearn/linear_model/_logistic.py:458: ConvergenceWarning: lbfgs failed to converge (status=1):
STOP: TOTAL NO. of ITERATIONS REACHED LIMIT.

Increase the number of iterations (max_iter) or scale the data as shown in:
    https://scikit-learn.org/stable/modules/preprocessing.html
Please also refer to the documentation for alternative solver options:
    https://scikit-learn.org/stable/modules/linear_model.html#logistic-regression
  n_iter_i = _check_optimize_result(
acc_list
✔️ 결과
[0.9114262227702425,
 0.9094739005343198,
 0.9173859432799013,
 0.914406083025072,
 0.9125565145910398]
np.array(acc_list).mean()
✔️ 결과
0.913049732840115크로스 벨리데이션을 사용하는 이유는 결과를 좋게 하기 위함이 아니라 믿을만한 검증을 하기 위함
728x90
반응형
'머신러닝' 카테고리의 다른 글
| [ 머신러닝 ] 랜덤 포레스트 (0) | 2023.09.11 |
|---|---|
| [ 머신러닝 ] 서포트 벡터 머신 (0) | 2023.09.06 |
| [ 머신러닝 ] 의사결정나무 (0) | 2023.09.06 |
| [ 머신러닝 ] 선형회귀 (0) | 2023.09.06 |
| [머신러닝] Titanic Dataset (2) | 2023.08.30 |